41 | 实战(五):如何实现3D地球可视化(下)?
你好,我是月影。
上节课,我们实现了一个有着星空背景的3D地球效果。但这个效果还比较简单,在某些可视化大屏项目中,我们不仅要呈现视觉效果,还要允许用户与可视化大屏中呈现的内容进行交互。所以这节课,我们会先给这个3D地球添加各种交互细节,比如让地球上的国家随着我们鼠标的移动而高亮,接着,我们再在地球上放置各种记号,比如光柱、地标等等。
如何选中地球上的地理位置?
我们先来解决上节课留下的一个问题,为什么我们在绘制3D地球的时候,要大费周章地使用topoJSON数据,而不是直接用一个现成的等角方位投影的世界地图图片作为球体的纹理。这是因为,我们想让地球能够和我们的鼠标进行交互,比如当点击到地图上的中国区域的时候,我们想让中国显示高亮,这是纹理图片无法实现的。接下来,我们就来看看怎么实现这样交互的效果。
实现坐标转换
实现交互效果的难点在于坐标转换。因为鼠标指向地球上的某个区域的时候,我们通过SpriteJS拿到的是当前鼠标在点击的地球区域的一个三维坐标,而这个坐标是不能直接判断点中的区域属于哪个国家的,我们需要将它转换成二维的地图经纬度坐标,才能通过地图数据来获取到当前经纬度下的国家或地区信息。
那如何实现这个坐标转换呢?首先,我们的鼠标在地球上移动的时候,通过SpriteJS,我们拿到三维的球面坐标,代码如下:
layer.setRaycast();globe.addEventListener('mousemove', (e) => {console.log(e.hit.localPoint);});...skyBox.attributes.raycast = 'none';
上面的代码中有一个小细节,我们将天空包围盒的raycast设置成了none。为什么要这么做呢?因为地球包围在天空盒子内,这样设置之后,鼠标就能穿透天空包围盒到达地球,如果不这么做,天空盒子就会遮挡住鼠标事件,地球也就捕获不到事件了。这样一来,当鼠标移动到地球上时,我们就可以得到相应的三维坐标信息了。
接下来,我们要将三维坐标信息转换为经纬度信息,那第一步就是将三维坐标转换为二维平面坐标。
/*** 将球面坐标转换为平面地图坐标* @param {*} x* @param {*} y* @param {*} z* @param {*} radius*/function unproject(x, y, z, radius = 1) {const pLength = Math.PI * 2;const tLength = Math.PI;const v = Math.acos(y / radius) / tLength; // const y = radius * Math.cos(v * tLength);let u = Math.atan2(-z, x) + Math.PI; // z / x = -1 * Math.tan(u * pLength);u /= pLength;return [u * mapScale * mapWidth, v * mapScale * mapHeight];}
这个球面和平面坐标转换,实际上就是将空间坐标系从球坐标系转换为平面直接坐标系。具体的转换方法是,我们先将球坐标系转为圆柱坐标系,再将圆柱坐标系转为平面直角坐标系。具体的公式推导过程比较复杂,我们没必要深入理解,你只要会用我给出的unproject函数就可以了。如果你对推导原理有兴趣可以回顾第15课,自己来推导一下,或者阅读这篇文章。
拿到了二维平面直角坐标之后,我们可以直接用等角方位投影函数的反函数将这个平面直角坐标转换为经纬度,代码如下:
function positionToLatlng(x, y, z, radius = 1) {const [u, v] = unproject(x, y, z, radius);return projection.invert([u, v]);}
接着,我们实现一个通过经纬度拿到国家信息的函数。这里,我们直接通过d3.geoContains方法,从countries数据中拿到对应的国家信息。
function getCountryInfo(latitude, longitude, countries) {if(!countries) return {index: -1};let idx = -1;countries.features.some((d, i) => {const ret = d3.geoContains(d, [longitude, latitude]);if(ret) idx = i;return ret;});const info = idx >= 0 ? {...countries.features[idx]} : {};info.index = idx;return info;}
这样一来,我们只要修改mousemove方法,就可以知道我们的鼠标移动在哪个国家之上了。
globe.addEventListener('mousemove', (e) => {const [lng, lat] = positionToLatlng(...e.hit.localPoint);const country = getCountryInfo(lat, lng, countries);if(country.properties) {console.log(country.properties.name);}});
高亮国家地区的方法
下一步,我们就可以实现一个方法来高亮鼠标移动到的国家或地区了。要高亮对应的国家或地区,其实处理起来并不复杂。我们先把原始的非高亮的图片另存一份,然后根据选中国家的index信息,从contries原始数据中取出对应的那个国家,用不同的填充色fillStyle再绘制一次,最后更新texture和layer,就可以将高亮区域绘制出来了。代码如下:
function highlightMap(texture, info, countries) {if(texture.index === info.index) return;const canvas = texture.image;if(!canvas) return;const idx = info.index;const highlightMapContxt = canvas.getContext('2d');if(!imgCache) {imgCache = new OffscreenCanvas(canvas.width, canvas.height);imgCache.getContext('2d').drawImage(canvas, 0, 0);}highlightMapContxt.clearRect(0, 0, mapScale * mapWidth, mapScale * mapHeight);highlightMapContxt.drawImage(imgCache, 0, 0);if(idx > 0) {const path = d3.geoPath(projection).context(highlightMapContxt);highlightMapContxt.save();highlightMapContxt.fillStyle = '#fff';highlightMapContxt.beginPath();path({type: 'FeatureCollection', features: countries.features.slice(idx, idx + 1)});highlightMapContxt.fill();highlightMapContxt.restore();}texture.index = idx;texture.needsUpdate = true;layer.forceUpdate();
仔细看上面的代码你会发现,这里我们实际上做了两点优化,一是我们在texture对象上记录了上一次选中区域的index。如果移动鼠标时,index没发生变化,说明鼠标仍然在当前高亮的国家内,没有必要重绘。二是我们保存了原始非高亮图片。之所以这样做,是因为我们只要将保存的非高亮图片通过drawImage一次绘制,然后再绘制高亮区域,就可以完成地图高亮效果,而不需要每次都重新用Path来绘制整个地图了,因而大大减少了Canvas2D绘图指令的数量,显著提升了性能。
实现了这个函数之后,我们改写mousemove事件处理函数,就能将这个交互效果完整地显示出来了。具体的代码和效果图如下:
globe.addEventListener('mousemove', (e) => {const [lng, lat] = positionToLatlng(...e.hit.localPoint);const country = getCountryInfo(lat, lng, countries);highlightMap(texture, country, countries);});
如何在地球上放置标记?
通过选中对应的国家,我们可以实现鼠标的移动的高亮交互效果。接下来,我们来实现另一个交互效果,在地球的指定经纬度处放置一些标记。
如何计算几何体摆放位置?
既然要把物体放置在地球指定的经纬坐标处,那我们接下来的操作依然离不开坐标转换。首先,我们知道几何体通常默认是以中心点为(0,0)点,但我们放置的时候,却需要将物体的底部放置在球面上,所以我们需要对球面坐标位置进行一个坐标变换。
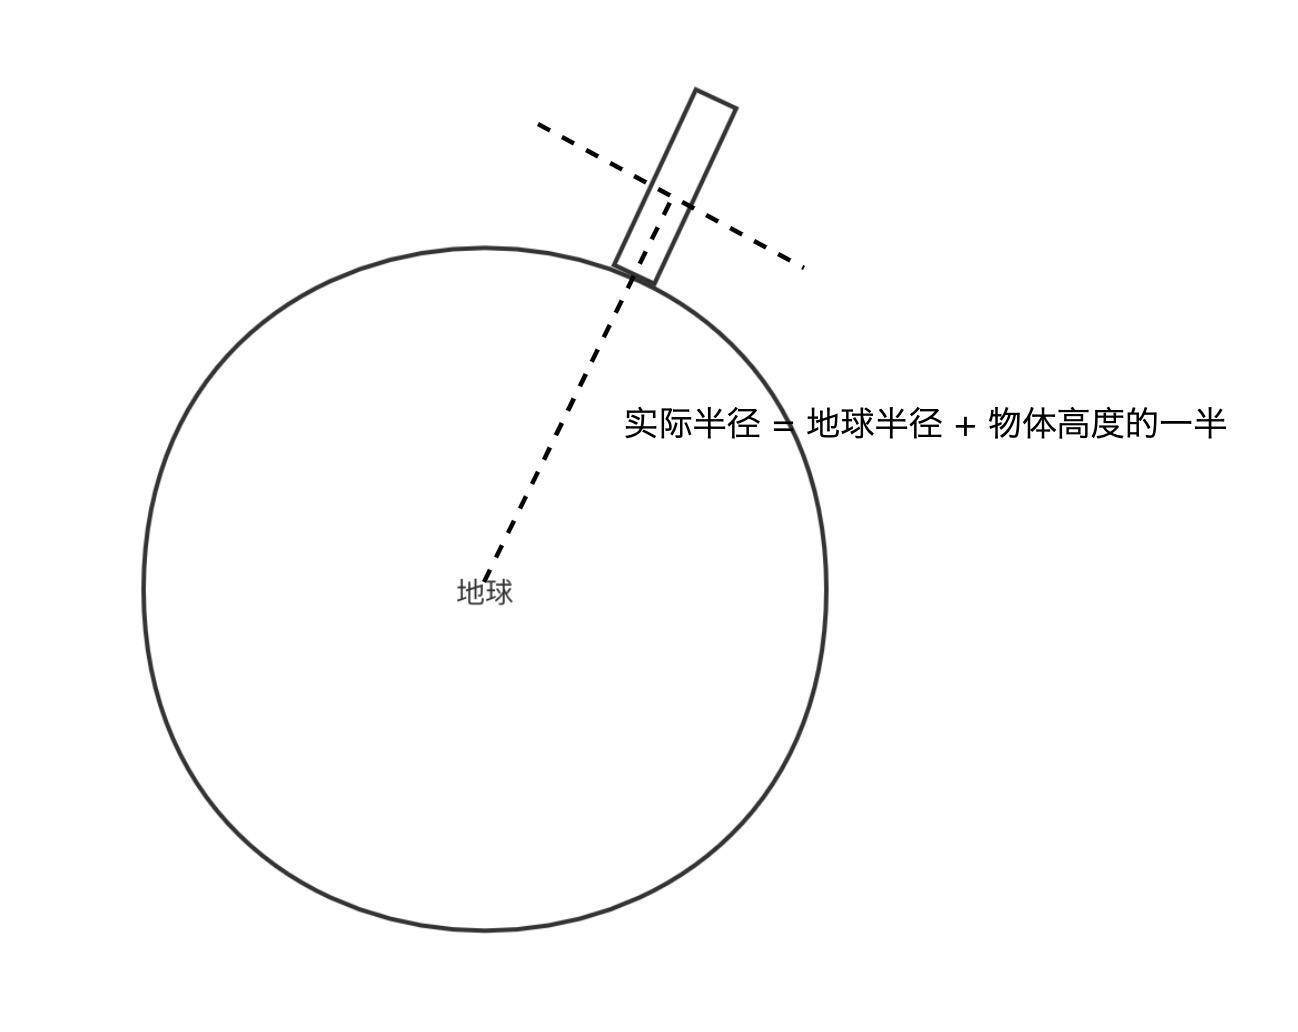
因此,我们在实现放置函数的时候,会通过 latlngToPosition 先将经纬度转成球面坐标pos,再延展到物体高度的一半,因为球心的坐标是0,0,所以pos位置就是对应的三维向量,我们使用scale就可以直接将它移动到我们要的高度了。
function setGlobeTarget(globe, target, {latitude, longitude, transpose = false, ...attrs}) {const radius = globe.attributes.radius;if(transpose) target.transpose();if(latitude != null && longitude != null) {const scale = target.attributes.scaleY * (attrs.scale || 1.0);const height = target.attributes.height;const pos = latlngToPosition(latitude, longitude, radius);// 要将底部放置在地面上pos.scale(height * 0.5 * scale / radius + 1);attrs.pos = pos;}target.attr(attrs);const sp = new Vec3().copy(attrs.pos).scale(2);target.lookAt(sp);globe.append(target);}
这里的 latlngToPosition 是前面 positionToLatlng 的反向操作,也就是先用 projection 函数将经纬度映射为地图上的直角坐标,然后用直角坐标转球面坐标的公式,将它转为球面坐标。具体的实现代码如下:
/*** 将经纬度转换为球面坐标* @param {*} latitude* @param {*} longitude* @param {*} radius*/function latlngToPosition(latitude, longitude, radius = 1) {const [u, v] = projection([longitude, latitude]);return project(u, v, radius);}/*** 将平面地图坐标转换为球面坐标* @param {*} u* @param {*} v* @param {*} radius*/function project(u, v, radius = 1) {u /= mapScale * mapWidth;v /= mapScale * mapHeight;const pLength = Math.PI * 2;const tLength = Math.PI;const x = -radius * Math.cos(u * pLength) * Math.sin(v * tLength);const y = radius * Math.cos(v * tLength);const z = radius * Math.sin(u * pLength) * Math.sin(v * tLength);return new Vec3(x, y, z);}
有了这个位置之后,我们将物体放上去,并且让物体朝向球面的法线方向。这一步我们可以用lookAt函数来实现。不过,lookAt函数是让物体的z轴朝向向量方向,而我们绘制的一些几何体,比如圆柱体,其实是要让y轴朝向向量方向,所以这种情况下,我们需要对几何体的顶点做一个转置操作,也就是将它的顶点向量的x、y、z的值轮换一下,让x = y、y = z、 z = x。这么做之后,我们就可以在地球表面摆放几何体了。
摆放光柱
我们先在地球的指定位置上放置一些光柱,光柱通常可以用来标记当前位置是一个重要的地点。光柱效果如下图所示:
这个效果怎么实现呢?因为光柱本身是圆柱体,所以我们可以用Cylindar对象来绘制。而光柱的光线还会随着高度衰减,对应的Shader代码如下:
const beamVertx = `precision highp float;precision highp int;attribute vec3 position;attribute vec3 normal;attribute vec4 color;uniform mat4 modelViewMatrix;uniform mat4 projectionMatrix;uniform mat3 normalMatrix;varying vec3 vNormal;varying vec4 vColor;uniform vec4 ambientColor; // 环境光uniform float uHeight;void main() {vNormal = normalize(normalMatrix * normal);vec3 ambient = ambientColor.rgb * color.rgb;// 计算环境光反射颜色float height = 0.5 - position.z / uHeight;vColor = vec4(ambient + 0.3 * sin(height), color.a * height);vec3 P = position;P.xy *= 2.0 - pow(height, 3.0);gl_Position = projectionMatrix * modelViewMatrix * vec4(P, 1.0);}`;const beamFrag = `precision highp float;precision highp int;varying vec3 vNormal;varying vec4 vColor;void main() {gl_FragColor = vColor;
实现Shader的代码并不复杂,在顶点着色器里,我们可以根据高度减少颜色的不透明度。另外,我们还可以根据高度对xy也就是圆柱的截面做一个扩展: P.xy *= 2.0 - pow(height, 3.0),这样就能产生一种光线发散(顶部比底部略大)的效果了。
于是,对应的addBeam函数实现如下所示。它就是根据参数创建对应的圆柱体对象,并把它们添加到地球对应的经纬度位置上。
function addBeam(globe, {latitude,longitude,width = 1.0,height = 25.0,color = 'rgba(245,250,113, 0.5)',raycast = 'none',segments = 60} = {}) {const layer = globe.layer;const radius = globe.attributes.radius;if(layer) {const r = width / 2;const scale = radius * 0.015;const program = layer.createProgram({transparent: true,vertex: beamVertx,fragment: beamFrag,uniforms: {uHeight: {value: height},},});const beam = new Cylinder(program, {radiusTop: r,radiusBottom: r,radialSegments: segments,height,colors: color,});setGlobeTarget(globe, beam, {transpose: true, latitude, longitude, scale, raycast});return beam;}}
摆放地标
除了摆放光柱,我们还可以摆放地标。地标通常表示当前位置产生了一个重大事件。地标实现起来会比光柱更复杂一些,它由一个定位点(Spot)和一个动态的标记(Marker)共同组成。摆放了地标的地图效果如下图所示:
想要实现它,第一步我们还是要实现对应的Shader。不过,我们这次需要实现两组Shader。首先是spot的顶点着色器和片元着色器,实现起来也非常简单。在顶点着色器中,我们根据uWidth扩展x、y坐标,根据顶点绘制出一个特定大小的平面图形。在片元着色器中,我们让图形的中心稍亮一些,让边缘亮度随着距离衰减,这么做是为了增强视觉效果。不过,由于分辨率的原因,具体的效果在截图中可能体现不出来,你可以运行示例代码把地球局部放大,来实际观察和体会一下。
const spotVertex = `precision highp float;precision highp int;attribute vec4 position;uniform mat4 modelViewMatrix;uniform mat4 projectionMatrix;uniform mat3 normalMatrix;uniform float uWidth;uniform float uSpeed;uniform float uHeight;varying vec2 st;void main() {float s = 0.0 + (0.2 * uWidth * position.w);vec3 P = vec3(s * position.xy, 0.0);st = P.xy;gl_Position = projectionMatrix * modelViewMatrix * vec4(P, 1.0);}`;const spotFragment = `precision highp float;precision highp int;uniform vec2 uResolution;uniform vec3 uColor;uniform float uWidth;varying vec2 st;void main() {float d = distance(st, vec2(0));gl_FragColor.rgb = uColor + 1.5 * (0.2 * uWidth - 2.0 * d);gl_FragColor.a = 1.
接着,我们实现marker的顶点着色器和片元着色器,它们稍微复杂一些。
const markerVertex = `precision highp float;precision highp int;attribute vec4 position;uniform mat4 modelViewMatrix;uniform mat4 projectionMatrix;uniform mat3 normalMatrix;uniform float uTime;uniform float uWidth;uniform float uSpeed;uniform float uHeight;varying float time;void main() {time = mod(uTime, 1.5 / uSpeed) * uSpeed + position.z - 1.0;float d = clamp(0.0, uWidth * mix(1.0, 0.5, min(1.0, uHeight)), time);float s = d + (0.1 * position.w);vec3 P = vec3(s * position.xy, uHeight * time);gl_Position = projectionMatrix * modelViewMatrix * vec4(P, 1.0);}`;const markerFragment = `precision highp float;precision highp int;uniform vec2 uResolution;uniform vec3 uColor;varying float time;void main() {float t = clamp(0.0, 1.0, time);gl_FragColor.rgb = uColor;gl_FragColor.a = 1.0 - t
在顶点着色器里,我们根据时间参数uTime来调整物体定点的高度。这样,当我们设置uHeight参数时,marker就能呈现出立体的效果。
有了这两组着色器之后,我们再实现两个函数,用来分别生成spot和marker的顶点,函数代码如下:
function makeSpotVerts(radis = 1.0, n_segments) {const vertex = [];for(let i = 0; i <= n_segments; i++) {const theta = Math.PI * 2 * i / n_segments;const x = radis * Math.cos(theta);const y = radis * Math.sin(theta);vertex.push(x, y, 1, 0, x, y, 1, 1.0);}return {position: {data: vertex, size: 4},};}function makeMarkerVerts(radis = 1.0, n_segments) {const vertex = [];for(let i = 0; i <= n_segments; i++) {const theta = Math.PI * 2 * i / n_segments;const x = radis * Math.cos(theta);const y = radis * Math.sin(theta);vertex.push(x, y, 1, 0, x, y, 1, 1.0);}const copied = [...vertex];vertex.push(...copied.map((v, i) => {return i % 4 === 2 ? 0.33 : v;}));vertex.push(...copied.map((v, i) => {return i % 4 === 2 ? 0.67 : v;}));return {position: {data: vertex, size: 4},};}
这两个函数都是用生成正多边形顶点的算法来生成对应的顶点,它们的区别是,spot只生成一组顶点,因为是平面图形,所以z坐标为0,而marker则生成三组不同高度的顶点组成立体的形状。
接着,我们再实现一个初始化函数,用来生成spot和marker对应的WebGLProgram,函数代码如下:
function initMarker(layer, globe, {width, height, speed, color, segments}) {const markerProgram = layer.createProgram({transparent: true,vertex: markerVertex,fragment: markerFragment,uniforms: {uTime: {value: 0},uColor: {value: new Color(color).slice(0, 3)},uWidth: {value: width},uSpeed: {value: speed},uHeight: {value: height},},});const markerGeometry = new Geometry(layer.gl, makeMarkerVerts(globe.attributes.radius, segments));const spotProgram = layer.createProgram({transparent: true,vertex: spotVertex,fragment: spotFragment,uniforms: {uTime: {value: 0},uColor: {value: new Color(color).slice(0, 3)},uWidth: {value: width},uSpeed: {value: speed},uHeight: {value: height},},});const spotGeometry = new Geometry(layer.gl, makeSpotVerts(globe.attributes.radius, segments));return {program: markerProgram,geometry: markerGeometry,spotGeometry,spotProgram,mode: 'TRIANGLE_STRIP',}
最后,我们实现addMarker方法,将地标添加到地球上。这样,我们就实现了绘制地标的功能。
function addMarker(globe, {latitude,longitude,width = 1.0,height = 0.0,speed = 1.0,color = 'rgb(245,250,113)',segments = 60,lifeTime = Infinity} = {}) {const layer = globe.layer;const radius = globe.attributes.radius;if(layer) {let mode = 'TRIANGLES';const ret = initMarker(layer, globe, {width, height, speed, color, segments});const markerProgram = ret.program;const markerGeometry = ret.geometry;const spotProgram = ret.spotProgram;const spotGeometry = ret.spotGeometry;mode = ret.mode;if(markerProgram) {const pos = latlngToPosition(latitude, longitude, radius);const marker = new Mesh3d(markerProgram, {model: markerGeometry, mode});const spot = new Mesh3d(spotProgram, {model: spotGeometry, mode});setGlobeTarget(globe, marker, {pos, scale: 0.05, raycast: 'none'});setGlobeTarget(globe, spot, {pos, scale: 0.05, raycast: 'none'});layer.bindTime(marker.program);if(Number.isFinite(lifeTime)) {setTimeout(() => {layer.unbindTime(marker.program);marker.dispose();spot.dispose();marker.program.remove();spot.program.remove();}, lifeTime);}return {marker, spot};}}
要点总结
今天,我们在上节课的基础上学习了与地球交互,以及在地球上放置标记的方法。
与地球交互的实现过程,我们可以总结为四步:首先我们通过将三维球面坐标转换为经纬度坐标,再通过topoJSON的API获取当前选中的国家或地区信息,然后在离屏Canvas上将当前选中的国家或地区高亮显示,最后更新纹理和重绘layer。这样,高亮显示的国家或地区就出现在3D地球上了。
而要在地球上放置标记,我们先要计算几何体摆放位置,然后实现标记对应的shader,创建WebGLProgram,最后将标记添加到地球表面对应经纬度换算的球面坐标位置处,用lookAt让它朝向法线方向就可以了。
到这里,地球3D可视化的核心功能我们就全部实现了。实际上,除了这些功能以外,我们还可以添加一些更加复杂的标记,比如两个点之间连线以及动态的飞线。这些功能实现的基本原理其实和放置标记是一样的,所以只要你掌握了我们今天讲的思路,就能比较轻松地解决这些需求了。
小试牛刀
实际上,地球上不仅可以放置普通的单点标记,还可以用曲线将两个地理点连接起来。具体的方法是在两个点之间计算弧线或贝塞尔曲线,然后将这些连线生成并绘制出来。在SpriteJS的3D扩展中有一个Path3d对象,它可以绘制空间中的三维曲线。你能试着实现两点之间的连线吗?如果很轻松就能实现,你还可以试着添加动画,实现两点之间的飞线动画效果。(提示:你可以通过官方文档来学习Path3d的用法,实现两点之间的连线。在实现飞线动画效果的时候,你可以参照GitHub仓库里的代码来进行学习,来理解我是怎么做的)
欢迎把你实现的效果分享到留言区,我们一起交流。也欢迎你把这节课转发出去,我们下节课见!
源码
示例代码详见GitHub仓库